Model output
Each output or model prediction is a probability—a number between 0 and 1—that represents how likely the patient will become compliant within 90 days. For example, if the model outputs a value of 0.8 for patient X on January 1, 2023, then the model predicts that patient X has an 80% chance of becoming compliant at some future date as per the CMS rule.
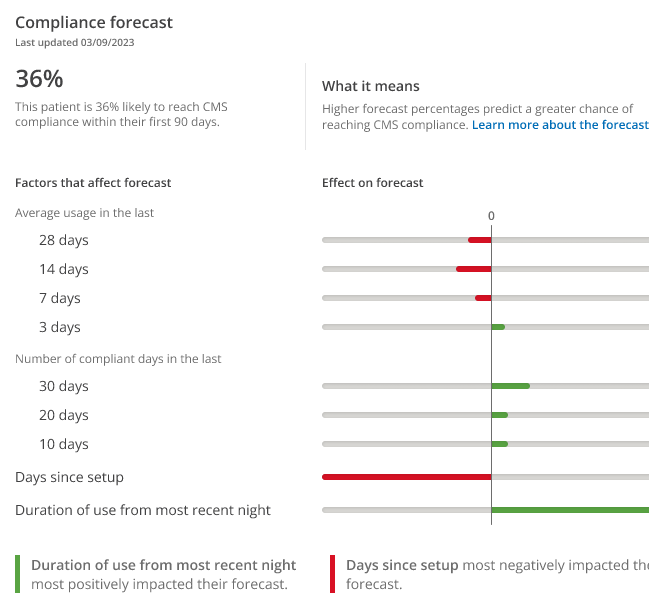
In addition to the probability forecast, ComplianceCoach also provide Shapley Additive Explanation (SHAP) values to HMEs for every prediction to explain how the model reaches a decision for each model input or feature. The length of the bars in the graph below represent relevant SHAP values.
Each key factor on the Compliance forecast score displays as either positive (green) or negative (red). The model ranks key factors based on their contribution to the final score. In the example below, duration from the most recent night has the highest positive impact on the compliance forecast score, followed by number of compliant days in the last 30 days. The patient's time on therapy (Days since setup) has the highest negative impact on the Compliance forecast.